Mar 30, 12 266 20% 33% SHORT 0
for the last number, value sitting between -9 to +9 indicate days with no particular weight, double digit positive or negative days are important movements, specially if repeated more days)
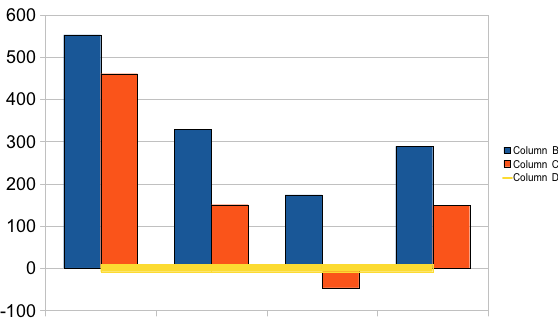
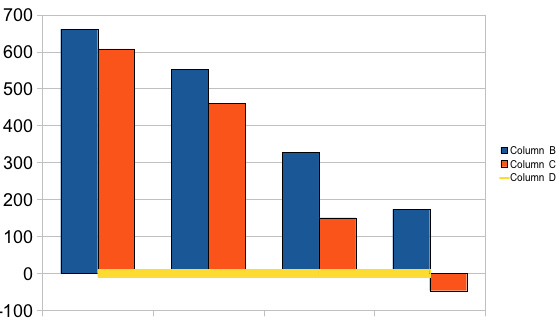
the TIDE profile graph composed of four set of columns,
the first set from left is the Tide number 3 weeks ago
the second set from left is the Tide number 2 weeks ago
the third set from left is the Tide number 1 week ago
the fourth set from left is the Tide number for the last market day
the orange column represent the short term indicator result
the dark blue column represent the long term indicator result